


Models
Models
In order to reproduce the COVID-19 spread with accuracy it is necessary to model the simulated environment in a realistic manner. EpiGraph includes five different models that are executed in coordination: the epidemic model that provides the COVID-19 propagation behaviour, the social model that depicts the characteristics and relationships of individuals within the population, the transportation model that considers the movement of the individuals, the environmental model that represents the ambiental elements (weather, pollution, etc.) that modulate the spread of the infection. We have recently incorporated a vaccination model, that captures the characteristics of each COVID-19 vaccine.
Epidemic model

We use the SEIR++ model with 17 different states to include states for latent, asymptomatic, and dead. We added an additional states for hospitalized, vaccinated (in the figure, states with T subindex) or those undergoing anti-viral therapies (v subindex). This model captures the mechanism by which susceptible individuals get infected and go through the different stages of the infection. The infectious period has three phases with different characteristics, which may affect the dissemination of the virus: pre-symptomatic infection, primary stage of symptomatic infection, and the second stage of symptomatic infection. We also consider the asymptomatic stage. Note that each stage has a related different R0 value. The time each individual spends in a given state is generated following a normal distribution to simulate the time ranges specific to each stage of the infection, so that each individual has different phase lengths. The hospitalization and death probabilities are age-dependent.
Social model.

The social model is represented via an undirected connection graph and can capture heterogeneity features at the level of both the individual and each of his/her interactions. We combine contact information from social networks with contact matrices to realistically approximate these connections. We allow for customizing individual interaction behavior based on the day of the week and the time of day. In this way, we model social structures such as companies, schools, and additionally groups of stay-at-home parents and retired people that are interacting in education programs, hobby classes, children’s school activities or any other kind of dynamics that make them come in contact with each other. At the level of the individual, we allow for the modeling of characteristics such as age, sex, and profession. The social model has been refined to include the following professions: industry, building, catering, services, public security, education, front-line health, non front-line health and social-health. The elderly collective has also been refined into three groups: elders in nursing homes, elders at home that attend day-care centres and elders that stay at home full-time. EpiGraph also incorporates profession-specific connections that include teachers with students, social-health workers with elderly people at nursing homes, health professionals with patients, catering workers with restaurant clients and public security professionals with people in general. The last four of these connection classes are dynamically generated, .i.e. the contacts are different every time.
Transportation model.
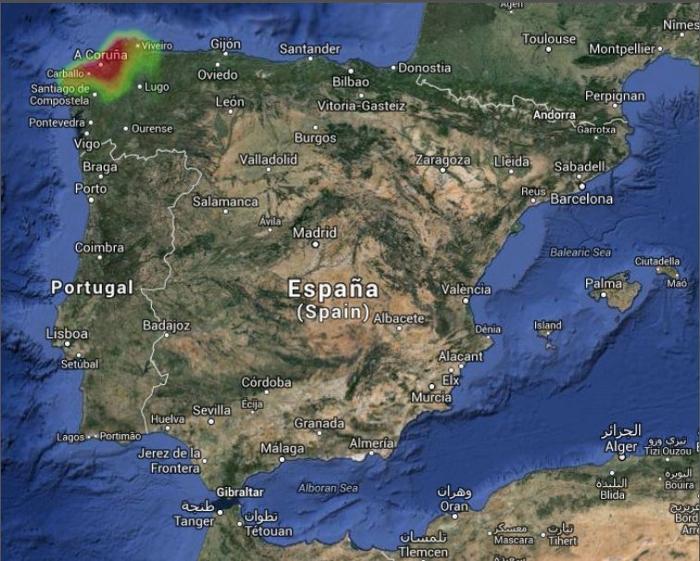
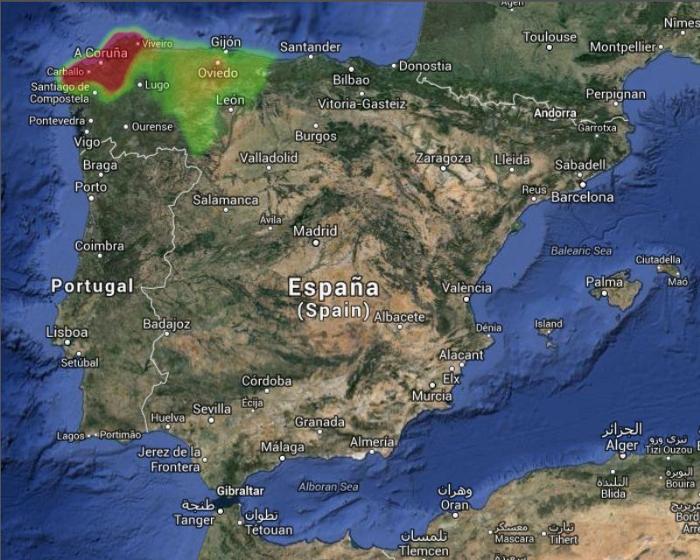
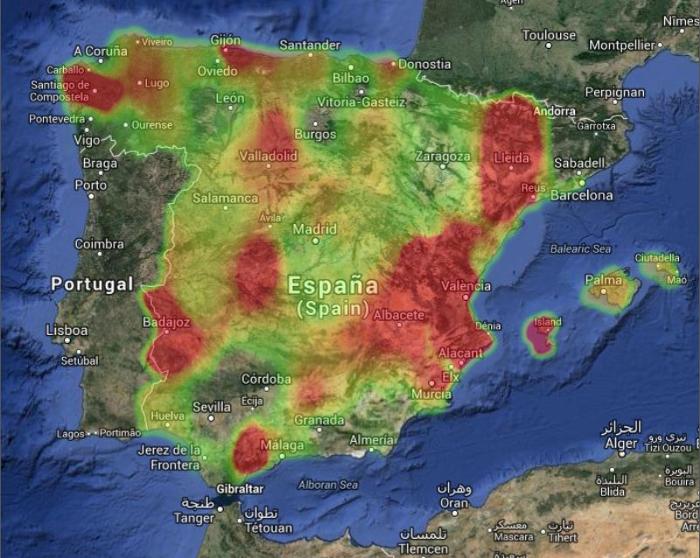
The transport component models the daily commute of individual to neighboring cities (inter-city movement) and long-distance trips over several days that represent the commuting of workers that need to reside at different locations or people that travel for vacation purposes. The people mobility model uses geographical information extracted from Google using the Google Distance Matrix API service.
Environmental model.
This model evaluates the impact of climate parameters on COVID-19 and influenza propagation. It integrates real meteorological data on the simulator in order to modulate the disease’s R0s values based on each particular weather condition.
Vaccination model.
The figure below shows an example of a time-dependent vaccine efficacy that is modelled in EpiGraph. The first dose (figure on the left) starts being effective 7 days after the vaccination. Then, during the following 7 days the efficacy scales up to 85%. The effect of the second dose (figure on the right) linearly increases the efficacy to 95%. The vaccination model also considers a tailing off of efficacy after a certain time, age-dependent efficacy, the risk of vaccine failure and different protection levels for preventing COVID-19 transmission among vaccinated individuals.
