


Current incidence estimate
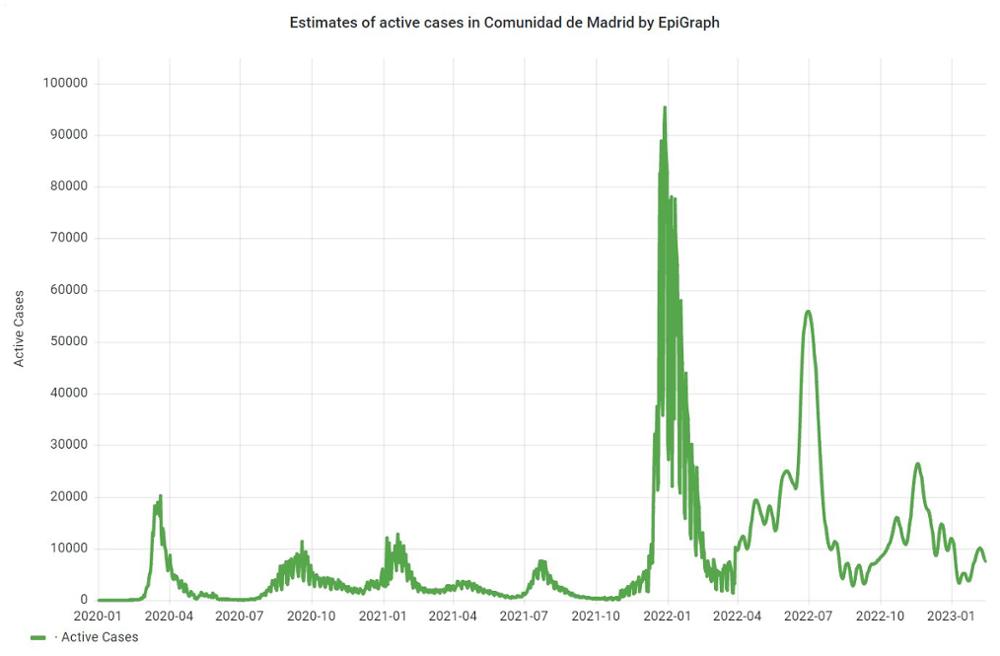
Estimates of active cases by EpiGraph
The following figures includes the latest estimates for Spain and Comunidad de Madrid provided by the EpiGraph team.

Estimates of active cases in Spain by Grupo de Modelización Estadística Avanzada
The following figure figure shows the estimated (green line) weekly Covid-19 incidence active cases in Spain. The blue and yellow lines represent represent the 97.5% and 2.5% credible interval, respectively. The data is provided by the Grupo de Modelización Estadística Avanzada from Universidad de Barcelona. More information about the methodology in the following link.

Estimates of infections in Spain by CoronaSurveys
The following figure includes the latest estimates provided by the CoronaSurvey team. See the definition of the values here.

Estimates of active cases in Spain by CoronaSurveys

Estimates of COVID-19 in the world by CoronaSurveys

PredCov © 2022